Wednesday, May 13, 2015
Tuesday, May 12, 2015
2015-05-11
EURUSD
The strengthening of EURUSD on the daily chart slowed down because of the increasing risks on the debt repayment by Greece. On Tuesday Greece must pay 750 million euro to the International Monetary Fund. According to our analysts, the successful debt repayment might bolster further the euro and vice versa. Market participants estimate the Greece default possibility at 25%. Later, on Wednesday we expect the release of important macroeconomic information in the EU: Q1 GDP and Industrial Production in the euro zone in March, as well as the similar indicators for Germany and Italy. According to forecasts, the European GDP is expected to grow, and the German GDP is more likely to fall. US Retail Sales in April are also expected to be published on Wednesday. The tentative outlook is negative.
At the end of April EUR/USD:D1 finished the sideways trading and moved higher. Now there is a pullback and the price is close to the previous resistance line, which has currently become the support level for a new uptrend. RSI-Bars are located in overbought area and are also showing signs of retracement. The downward bias of the moving average (200) is decreasing. We deem that a bullish momentum might be formed after the price rising above the upper Donchian Channel boundary and the last fractal high at 1.1387, or crossing down the upper boundary of the previous range and the last fractal low at 1.105, in case of a bearish momentum. Let the market choose the price movement scenario. Two pending orders can be placed: when one of them is activated, the other can be canceled, since the market has chosen the direction. After pending order placing, Stop loss is to be moved every four hours to the next fractal high (short position) or fractal low (long position), following Parabolic signals. The most careful traders can switch to the H4 timeframe after order execution, placing Stop loss and moving it according to the price direction. Thus, we are changing the probable profit/loss ratio to the breakeven point. If the price meets the Stop loss level without reaching the order, we recommend cancelling the position: the market sustains internal changes which were not considered.BOE: Official Bank Rate
Today we examine the price activity of the GBP/USD currency pair on the H4 chart. The price approached the daily resistance line and entered the consolidation phase. In this case the most unambiguous signals are coming from the RSI-Bars oscillator. Note that the current bar has already crossed the last low (see red ellipse on the figure). It certainly tells us about the strengthening of the bearish sentiment ahead of the Interest Rate Statement released today by the Bank of England (13:00 CET).
Note that the daily resistance at 1.55533 was confirmed for three times and, thus, can be a reliable level of risk mitigation when going short. This level importance is also proved by the upper Donchian Channel boundary. We expect that the closest to price resistance of the RSI-Bars will serve for support level. It means that conservative traders should wait for the breakout of this level to confirm the bearish sentiment. A pending sell order may be placed below 1.53543. The breakout of this mark is likely to lead to the cross-over of the assumed RSI support. Stop loss is to be moved every day to the break-even point, placing it above the last high (trend-following strategy). Thus, we are changing the probable profit/loss ratio to the breakeven point.Friday, May 8, 2015
Anticipating labor market reports
Anticipating labor market reports- 2015-05-08
Let us consider USDCAD, one of major commodity currencies. In January 2015 the Bank of Canada cut the overnight target rate from 1% to 0.75%. At following meetings in March and recently on April 15 it left the interest rates at the same level. The central bank also revised downward its 2015 GDP forecast to 1.9 % from a previous estimate of 2.1 %. At the same time the Bank of Canada expects stronger US and global growth will combine to create higher demand for non-energy exports, offsetting the fall in energy exports and boosting investment. Recent data indicated the GDP in February remained unchanged after 0.2% decline in January while the consumer prices index in Canada increased 1.2% year-on-year in March from 1% in the previous month, and unemployment stayed stable at 6.8%. At the same time the trade deficit in March widened to CAD 3.02 billion from CAD 2.22 billion in February. On Friday labor market data will be reported, which will provide a boost to volatility. The unemployment rate is expected to rise in April to 6.9%, which will negatively affect the Canadian currency. Simultaneously the closely watched US nonfarm payrolls report will be released in US, and expectations are for a gain of 230 thousand jobs in the private sector while the unemployment rate is expected to fall to 5.4% from 5.5% in March. Such a positive development is certain to strengthen the US dollar against major currencies, pushing the USDCAD higher. However, there is a chance that the increase in private sector jobs may fall short of the expected 230 thousand gain in nonfarm payrolls, reinforcing expectations that the Fed will not raise the interest rates until late in the year. In such a scenario the US dollar will not receive a boost against its rivals.The USDCAD had been trading in a range for over two months with key support and resistance levels at 1.23513 and 1.28333. On April 15 it broke the key support level and closed below it, forming a bearish bias that has continued till the present. The RSI-Bars oscillator indicates downtrend. The retracement that started on April 30 reversed two days later but ended with Hammer candlestick pattern. The Hammer candlestick formation is a bullish reversal pattern that occurs at the bottom of downtrends. The breach of the upper Donchian channel at 1.2304 following a break above the last fractal high at 1.22037 will signify the formation of bullish momentum that will push the pair back into the trading range. We do not exclude also the resumption of the downtrend movement after the current retracement ends and the pair breaches the lower Donchian channel at 1.1943. Let the market choose the price movement scenario. Two pending orders can be placed: when one of them is activated, the other can be canceled, since the market has chosen the direction. After pending order placing, the stop loss is to be moved every day to the next fractal high (short position) or fractal low (long position), following Parabolic signals. Thus, we are changing the probable profit/loss ratio to the breakeven point. If the price meets the stop loss level without reaching the order, we recommend cancelling the position: the market sustains internal changes which were not considered.
Thursday, May 7, 2015
Soybean trying to rise
Soybean trying to rise 2015-05-06
Today we examine the chart of soybeans CFD or SOYB. The price has tumbled almost 40% over a year and is located now in a range. We don’t rule out the possibility of rising soybean prices due to the following reasons: weak macroeconomic statistics drags down the US dollar (SOYB is quoted in USD). Recently there has been an increased demand for US soybeans in China. In Argentina there is a strike of farm workers, demanding raising wages by 45% as the inflation rate is expected to be 30% this year. In the meantime, this country has been ranked the first one in the exports of soybean oil, which is used for biofuel and fodder production. Argentina is the third largest country in the world in soybean exports. Note that market participants expect soybean prices to retrace after the strike is over. Soybean crop in Argentina in 2014/2015 season is expected to reach 60 mln tons, 2 mln tons more compared to the previous season.
SOYB:D1 has already been traded sideways for seven months after a strong downfall last year. Lately it has left the two-month downtrend and is currently trying to form an uptrend. Parabolic showed a buy signal. RSI-Bars oscillator overcame the average level of 50 and is still far away from the overbought zone. There is no divergence observed. In our opinion, you can go long when the price crosses the upper Donchian Channel boundary and the fractal at 992.5. You may place the pending buy order above this level. Stop loss is to be placed at the last fractal low and Parabolic point at 958.8. After pending order placing, Stop loss is to be moved every four hours near the next fractal low, following Parabolic and Donchian signals. The most careful traders can switch to the H4 timeframe after order execution, placing Stop loss and moving it according to the price direction. Thus, we are changing the probable profit/loss ratio to the breakeven point. If the price meets the Stop loss without reaching the order, we recommend cancelling the position: market sustains internal changes that were not considered.Monday, May 4, 2015
Triangle breakout
Conservative traders are recommended to wait until the RSI-Bars breaches the support at 78%, confirming the bullish momentum. The oscillator has now been showing the ascending channel: the signal has been moving closer to the support line. However, the resistance breakout is likely to boost volatility and make the price cross 67.31 once again; a buy pending order may be placed at this mark. A stop loss may be placed below the latest fractal at 65.82: both Parabolic and H4 trend confirm this level. After pending order activation the stop loss is supposed to be moved every four hours, following Parabolic signals. Thus we are changing the probable profit/loss ratio to the breakeven point.
Friday, March 20, 2015
European stocks up after 3-day pullback
Yesterday American stocks showed a slight pullback on the back of
growing US Dollar Index. They have been moving in opposite directions
lately. Investors' sentiment was mixed after Fed reported on Wednesday
they were not in a hurry with rate hike. It resulted in a strong market
movement. The statement undermined the dollar while the euro has shown
the sharpest weekly increase in 18 months. However, some investors
believe that other majors are even in a worse situation and the dollar
has been strengthening today. The decline in Philadelphia Manufacturing
produced additional negative effect on stocks. In March it has plunged
to its weakest 5 points since February, 2014. Investors are concerned
about labor market statistics that may be worse-than-expected. Yesterday
the trade volume on American stocks was 7% below the monthly average,
amounting to 6.2 bln shares. No macroeconomic news are expected today in
the US.
After the 3-day pullback European stocks are growing today together
with American indices futures. Greek Athex edged 3%. Alexis Tsipras
assured European creditors, that his coalition would soon present a full
pack of anti-default measures. European shares are also underpinned by
estimated merger deals within construction and bank segments. Holcim and
Lafarge gained 1.3% and 3.5% as TSB and Banco Sabadell added 2% and
1.5% respectively. Nikkei
has recorded today its 15-year high. The index has been rising for 6
straight weeks. Nintendo shares have jumped 35% in 2 days after the
company reported it was going to expand to mobile games market. To be
noted, Bank of Japan kept its monetary stimulus program unchanged this
week. Bank head Haruhiko Kuroda stated that it was necessary to reach
target 2% inflation rate this financial year even by means of raising
emission. We believe that due to this announcement the yen ceased its
surge. Forthcoming economic data from japan are anticipated on Tuesday.

Oil prices
have been falling 2 consequent days after Kuwait declared that OPEC
should keep the current oil output til the next meeting in June. The
prime minister said that he wouldn't be surprised if oil declined below
$50 per barrel in several weeks. The export from Iranian South oil
terminals has advanced in March to 2.66 mln barrels per day as compared
to 2.29 in February. The reason is that good weather in the Persian Gulf
allowed using a large number of tank ships. The country is going to
raise export to 3 mln. Besides, due to oil workers strike, US crude
reserves have reached their 80-year high. Angola forecast surge in oil
production to 1.84 bln barrels which is 10% above the previous year
supply. Selling carbohydrates makes up about 50% of GDP and accounts for
80% of taxes and 90% of exports in the country.

Copper quotes expanded due to strike at an Indonesian mine owned by
Freeport-McMoRan company.

Gold has marked the maximum weekly gain since January because of Fed
statement. SPDR Gold Trust has reported growing reserves for the first
time. Shanghai Gold Exchange premium has reached $6-7 in relation to
London. To be noted the delta between gold and platinum ounce prices
rose to its 2-year high ($55). That may indicate that platinum is
undervalued and be used for creating a PCI.
RSI Bars Indicator: Forex Oscillator
RSI Bars Indicator: Forex Oscillator: 20-03-15
Destination
RSI-Bars is an oscillator, developed by IFC Markets in 2014 as the modification of Relative Strength Index (RSI). RSI-Bars characterizes a stability of a price momentum and allows a definition of a trend potential.A distinctive feature of RSI-Bars is that this indicator takes into account the volatility of a considered instrument within the selected timeframe - values of RSI-Bars are defined with account of price OPEN/HIGH/LOW/CLOSE (OHLC) values and are displayed in the form of chart bars. This allows avoiding of false breakdowns of oscillator trend lines and that’s why traders may use methods of a chart analysis more efficiently in this case.
Metatrader 4 Download
Download RSI-Bars for Metatrader 4
Installation guide:
- Download and extract the zip archive with indicator file .ex4;
- Open the data directory from the main menu of Metatrader 4 terminal:File =>Open Data Folder;
- Put an indicator file into the folder MQL4/Indicators of Data Folder;
- Restart the Metatrader 4 terminal;
- In order to insert an indicator, open the group of custom indicators in the main menu: Insert=>Indicators=>Custom indicator.
Advantages of RSI-Bars oscillator
In contrast to the classical Relative Strength Index, developed by J.Wilder, RSI-Bars evaluates an internal volatility. Minimal and maximum limits of bars are constructed on the basis of 4 prices (OHLC). A calculated set is used for the selection of a minimum and maximum value of RSI-Bars. Then a bar structure is formed.
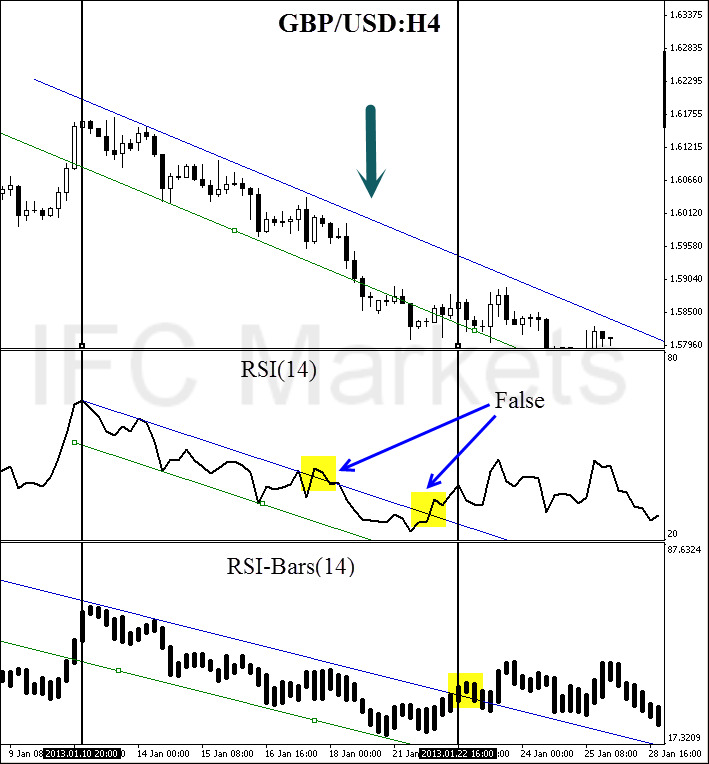
A comparative analysis of RSI and RSI-Bars is represented on the figure below – we used H4 candlesticks of a most volatile pair, GBP/USD. As it can be seen, RSI(14) has shown and additional breakdown in contrast with RSI-Bars (14). Moreover, RSI-Bars has detected later and therefore more correct finishing of a downtrend.
The use of RSI-Bars is demonstrated in trade examples of everyday analytics releases of IFC Markets.

RSI-Bars Indicator
Application
- The oscillator works most efficiently in a flat motion. A lower and higher bounds of oscillator values are introduced subjectively (for example 30% and 70%) and correspond to overbought and oversold levels;
- RSI-Bars can take extreme values during a trend motion. That’s why in this case a use of overbought and oversold levels is incorrect;
- RSI-Bars allows a definition of standard chart analysis instruments - figures, lines of support and resistance, etc. In this case the indicator should be used for a confirmation of technical analysis. We should take into account that RSI-Bars can give preliminary signals of a trend change;
- Divergence is the strongest signal of RSI-Bars – opposite directions of price and oscillator movements are detected in this case. This signal is a harbinger of a possible trend weakening;
- Values of RSI-Bars lie between 0% and 100%.
Thursday, March 19, 2015
Technical Analysis 2015-03-19
Technical Analysis USDCHF:
US stocks rallied on Wednesday after the Federal Reserve indicated that the pace of interest rate hikes will be slower than previously expected. The Fed dropped from its statement the reference to being ’patient’ before raising interest rates, but Fed Chair Janet Yellen told at the conference that the change didn’t mean the Fed was in a rush to hike interest rates. Officials cut their median estimate for the federal funds rate at the end of 2015 to 0.625 percent, down from 1.125 percent in December forecasts. Policy makers also downgraded US growth outlook: according to new projections US economy is expected to grow 2.3 to 2.7 percent this year and next, down from the 3 percent forecast for both years made in December. The dollar fell against major currencies. Today at 13:30 CET Initial Jobless Claims for the week ended March 14 and Continuing Claims for the week ended March 7 will be released in US. The tentative outlook is neutral for the dollar. At 15:00 CET the Philadelphia Fed’s Business Outlook March Survey results will be published. The tentative outlook is positive. At the same time the Conference Board Leading Indicator for February will be released, which is expected to remain unchanged.
European stocks rose on Wednesday as UK energy shares climbed after the government presented a budget outline including investment and tax cuts for North Sea oil industry, and construction and materials shares advanced on expectations of a merger deal between French leading construction company Lafarge and Switzerland’s Holcim. The Stoxx Europe 600 rose 0.3%. Euro climbed to its highest level in eight days after the Fed’s statement indicated that it is in no hurry to hike interest rates. Automaker shares fell as investors took profits after the sector’s 30 percent rally this year. Germany’s DAX 30 lost 0.5 % as BMW fell 4.2 % after announcing lower expected earnings than forecasts a year ago.
Nikkei fell today as investors took profits on financial shares on concerns that falling yields on Japanese government bonds after the dovish Fed statement may weaken banking sector. The yen gained one percent against the dollar following the Fed's policy meeting. Three more public funds are expected to announce on Friday they will start investing in Japanese stocks with a common model portfolio in line with asset allocation of the trillion-dollar Government Pension Investment Fund. That would provide additional 3.58 trillion yen ($30 billion) support for Japanese stocks. It is worth noting that GPIF purchases of stocks instead of bonds has helped drive Nikkei to 15-year highs this week, and Nikkei has risen more than eight percent in the past month.
Oil prices rose on Wednesday as the dollar weakened against major rivals after the Federal Reserve statement. The rebound in oil prices will likely be short- lived as no fundamental change has taken place to address the global oversupply issue.
Gold prices advanced on Wednesday after the Fed dovish statement. A major change is expected in gold market tomorrow when the London Bullion Market Association will launch an electronic auction process operated by the ICE Benchmark Administration after the London Gold fix is discontinued. As China is expected to participate directly in setting the new price fix, the price differences between Shanghai and London markets are expected to smooth out.
Thursday, March 12, 2015
By opening an account with IFC Markets you will get:
Instant execution with fixed spreads for hundreds of financial instruments: currencies, stocks, indices, commodities and metals
Leverage up to 1:400 on currencies, indices and commodities, and 1:40 leverage on stocks
Continuous CFD Trading with no expiry dates on commodities and indexes
A software package for creating own synthetic financial instruments, portfolios, cross rates from financial assets and indices like ETF.
The capability to quote portfolios against each other by the Geworko Method, build their charts and trade them
Popular and complementary Forex and CFD trading platforms NetTradeX and MetaTrader 4
More information just click this Home
Subscribe to:
Posts (Atom)