Live Quetes

Friday, March 20, 2015

European stocks up after 3-day pullback

Yesterday American stocks showed a slight pullback on the back of growing US Dollar Index. They have been moving in opposite directions lately. Investors' sentiment was mixed after Fed reported on Wednesday they were not in a hurry with rate hike. It resulted in a strong market movement. The statement undermined the dollar while the euro has shown the sharpest weekly increase in 18 months. However, some investors believe that other majors are even in a worse situation and the dollar has been strengthening today. The decline in Philadelphia Manufacturing produced additional negative effect on stocks. In March it has plunged to its weakest 5 points since February, 2014. Investors are concerned about labor market statistics that may be worse-than-expected. Yesterday the trade volume on American stocks was 7% below the monthly average, amounting to 6.2 bln shares. No macroeconomic news are expected today in the US. After the 3-day pullback European stocks are growing today together with American indices futures. Greek Athex edged 3%. Alexis Tsipras assured European creditors, that his coalition would soon present a full pack of anti-default measures. European shares are also underpinned by estimated merger deals within construction and bank segments. Holcim and Lafarge gained 1.3% and 3.5% as TSB and Banco Sabadell added 2% and 1.5% respectively. Nikkei has recorded today its 15-year high. The index has been rising for 6 straight weeks. Nintendo shares have jumped 35% in 2 days after the company reported it was going to expand to mobile games market. To be noted, Bank of Japan kept its monetary stimulus program unchanged this week. Bank head Haruhiko Kuroda stated that it was necessary to reach target 2% inflation rate this financial year even by means of raising emission. We believe that due to this announcement the yen ceased its surge. Forthcoming economic data from japan are anticipated on Tuesday. 
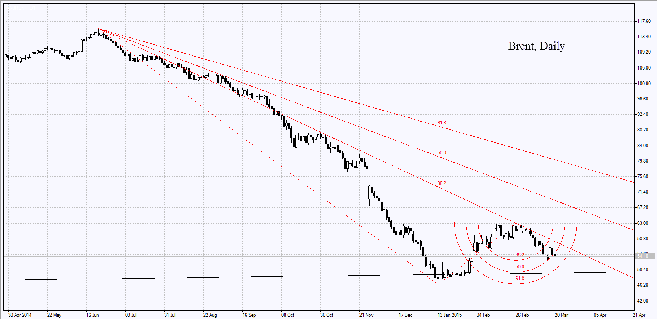

Brent

Oil prices have been falling 2 consequent days after Kuwait declared that OPEC should keep the current oil output til the next meeting in June. The prime minister said that he wouldn't be surprised if oil declined below $50 per barrel in several weeks. The export from Iranian South oil terminals has advanced in March to 2.66 mln barrels per day as compared to 2.29 in February. The reason is that good weather in the Persian Gulf allowed using a large number of tank ships. The country is going to raise export to 3 mln. Besides, due to oil workers strike, US crude reserves have reached their 80-year high. Angola forecast surge in oil production to 1.84 bln barrels which is 10% above the previous year supply. Selling carbohydrates makes up about 50% of GDP and accounts for 80% of taxes and 90% of exports in the country. 


Copper

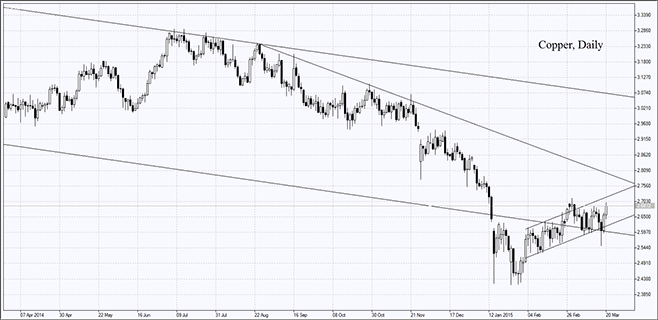
Copper quotes expanded due to strike at an Indonesian mine owned by
Freeport-McMoRan company.

Gold

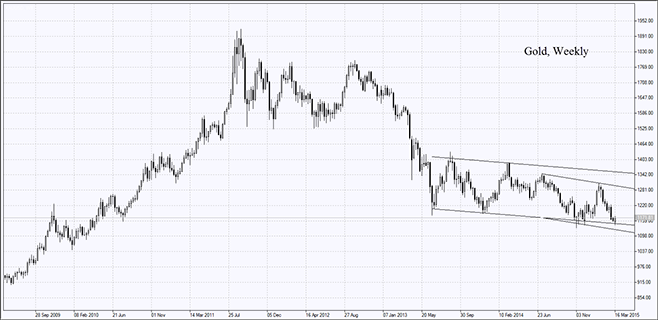
Gold has marked the maximum weekly gain since January because of Fed statement. SPDR Gold Trust has reported growing reserves for the first time. Shanghai Gold Exchange premium has reached $6-7 in relation to London. To be noted the delta between gold and platinum ounce prices rose to its 2-year high ($55). That may indicate that platinum is undervalued and be used for creating a PCI.

RSI Bars Indicator: Forex Oscillator

RSI Bars Indicator: Forex Oscillator: 20-03-15

Destination

RSI-Bars is an oscillator, developed by IFC Markets in 2014 as the modification of Relative Strength Index (RSI). RSI-Bars characterizes a stability of a price momentum and allows a definition of a trend potential.
A distinctive feature of RSI-Bars is that this indicator takes into account the volatility of a considered instrument within the selected timeframe - values of RSI-Bars are defined with account of price OPEN/HIGH/LOW/CLOSE (OHLC) values and are displayed in the form of chart bars. This allows avoiding of false breakdowns of oscillator trend lines and that’s why traders may use methods of a chart analysis more efficiently in this case.

Metatrader 4 Download

Download RSI-Bars for Metatrader 4

Installation guide:
  • Download and extract the zip archive with indicator file .ex4;
  • Open the data directory from the main menu of Metatrader 4 terminal:File =>Open Data Folder;
  • Put an indicator file into the folder MQL4/Indicators of Data Folder;
  • Restart the Metatrader 4 terminal;
  • In order to insert an indicator, open the group of custom indicators in the main menu: Insert=>Indicators=>Custom indicator.

Advantages of RSI-Bars oscillator

In contrast to the classical Relative Strength Index, developed by J.Wilder, RSI-Bars evaluates an internal volatility. Minimal and maximum limits of bars are constructed on the basis of 4 prices (OHLC). A calculated set is used for the selection of a minimum and maximum value of RSI-Bars. Then a bar structure is formed.
Технические Индикаторы: RSI Bars
An analysis of a candlestick price chart in some cases allows avoiding of a trend false breakdowns. It happens due to the account of additional price information and it internal volatility. At the same way RSI-Bars takes into account a true range of price oscillations, not only a characteristic value of a given timeframe. Due to this property, RSI-Bars allows a correct and convenient use of a chart technical analysis.
A comparative analysis of RSI and RSI-Bars is represented on the figure below – we used H4 candlesticks of a most volatile pair, GBP/USD. As it can be seen, RSI(14) has shown and additional breakdown in contrast with RSI-Bars (14). Moreover, RSI-Bars has detected later and therefore more correct finishing of a downtrend.
The use of RSI-Bars is demonstrated in trade examples of everyday analytics releases of IFC Markets.
technical indicators: chart
RSI-Bars Indicator

Application

  • The oscillator works most efficiently in a flat motion. A lower and higher bounds of oscillator values are introduced subjectively (for example 30% and 70%) and correspond to overbought and oversold levels;
  • RSI-Bars can take extreme values during a trend motion. That’s why in this case a use of overbought and oversold levels is incorrect;
  • RSI-Bars allows a definition of standard chart analysis instruments - figures, lines of support and resistance, etc. In this case the indicator should be used for a confirmation of technical analysis. We should take into account that RSI-Bars can give preliminary signals of a trend change;
  • Divergence is the strongest signal of RSI-Bars – opposite directions of price and oscillator movements are detected in this case. This signal is a harbinger of a possible trend weakening;
  • Values of RSI-Bars lie between 0% and 100%.


Thursday, March 19, 2015

Technical Analysis 2015-03-19


Technical Analysis USDCHF: 


US stocks rallied on Wednesday after the Federal Reserve indicated that the pace of interest rate hikes will be slower than previously expected. The Fed dropped from its statement the reference to being ’patient’ before raising interest rates, but Fed Chair Janet Yellen told at the conference that the change didn’t mean the Fed was in a rush to hike interest rates. Officials cut their median estimate for the federal funds rate at the end of 2015 to 0.625 percent, down from 1.125 percent in December forecasts. Policy makers also downgraded US growth outlook: according to new projections US economy is expected to grow 2.3 to 2.7 percent this year and next, down from the 3 percent forecast for both years made in December. The dollar fell against major currencies. Today at 13:30 CET Initial Jobless Claims for the week ended March 14 and Continuing Claims for the week ended March 7 will be released in US. The tentative outlook is neutral for the dollar. At 15:00 CET the Philadelphia Fed’s Business Outlook March Survey results will be published. The tentative outlook is positive. At the same time the Conference Board Leading Indicator for February will be released, which is expected to remain unchanged.


European stocks rose on Wednesday as UK energy shares climbed after the government presented a budget outline including investment and tax cuts for North Sea oil industry, and construction and materials shares advanced on expectations of a merger deal between French leading construction company Lafarge and Switzerland’s Holcim. The Stoxx Europe 600 rose 0.3%. Euro climbed to its highest level in eight days after the Fed’s statement indicated that it is in no hurry to hike interest rates. Automaker shares fell as investors took profits after the sector’s 30 percent rally this year. Germany’s DAX 30 lost 0.5 % as BMW fell 4.2 % after announcing lower expected earnings than forecasts a year ago.
Nikkei fell today as investors took profits on financial shares on concerns that falling yields on Japanese government bonds after the dovish Fed statement may weaken banking sector. The yen gained one percent against the dollar following the Fed's policy meeting. Three more public funds are expected to announce on Friday they will start investing in Japanese stocks with a common model portfolio in line with asset allocation of the trillion-dollar Government Pension Investment Fund. That would provide additional 3.58 trillion yen ($30 billion) support for Japanese stocks. It is worth noting that GPIF purchases of stocks instead of bonds has helped drive Nikkei to 15-year highs this week, and Nikkei has risen more than eight percent in the past month.
Oil prices rose on Wednesday as the dollar weakened against major rivals after the Federal Reserve statement. The rebound in oil prices will likely be short- lived as no fundamental change has taken place to address the global oversupply issue.
Gold prices advanced on Wednesday after the Fed dovish statement. A major change is expected in gold market tomorrow when the London Bullion Market Association will launch an electronic auction process operated by the ICE Benchmark Administration after the London Gold fix is discontinued. As China is expected to participate directly in setting the new price fix, the price differences between Shanghai and London markets are expected to smooth out.


Thursday, March 12, 2015


By opening an account with IFC Markets you will get: 

  • Instant execution with fixed spreads for hundreds of financial instruments: currencies, stocks, indices, commodities and metals

  • Leverage up to 1:400 on currencies, indices and commodities, and 1:40 leverage on stocks

  • Continuous CFD Trading with no expiry dates on commodities and indexes

  • A software package for creating own synthetic financial instruments, portfolios, cross rates from financial assets and indices like ETF.

  • The capability to quote portfolios against each other by the Geworko Method, build their charts and trade them

  • Popular and complementary Forex and CFD trading platforms NetTradeX and MetaTrader 4 

    More information just click this Home